
Yellowcog driver and vehicle data collection with eye-tracking, physiological monitoring and car performance data. Lots of channels of data are collected in this video which is recorded from the driver's point of view. The video shows the driver's "point of gaze" (using eye-tracking technology), heart rate, breathing rate, core body temperature and an exertion score. Added to the physiological information is a range of car data.
The on-screen overlays show the following information:
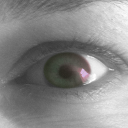
- Eye-tracking circle -- The white circle shows where the driver's "point of gaze" falls. Black concentric circles are used to represent peripheral vision.
- Exertion -- a measure of how hard the driver is working. E.g. 0% represents a person at rest and 100% would be flat-out in the gym.
- Body temperature -- A gauge showing the core temperature of the driver. This is measured by taking skin temperature and combining this with other parameters to approximate the core body temperature.
- Heart rate -- the beating heart icon pulses in time with the driver's heartbeat. The number in the middle is the beats per minute.
- Breathing rate -- The lungs icon expands and contracts according to the driver's chest expansion. The number in the middle is the average breaths per minute.
- Speed -- this is the speed of the car, taken from GPS and also accelerometer readings.
- RPM -- this is the number of revolutions per minute of the engine. The information comes direct from the car's on-board Engine Control Unit (ECU).
- Power -- the kilowatt output of the engine, taken from the ECU.
- Throttle -- the physical position of the throttle pedal.
- G Force -- this is the physical g-force experienced by the driver and is caused by cornering, accelerating and braking.
![]() Yellowcog developed the system for use in top-end motorsport which has so far included Le Mans, IndyCar and rallying. Recently we used a system for a word record attempt by Mark Higgins who set a new lap record for a production car (a 2015 Subaru WRX STi) on the Isle of Man TT circuit -- have a look around YouTube using yellowcog, Subaru and TT as search terms - you can see just how hard a racing driver needs to work to be the best!
Yellowcog developed the system for use in top-end motorsport which has so far included Le Mans, IndyCar and rallying. Recently we used a system for a word record attempt by Mark Higgins who set a new lap record for a production car (a 2015 Subaru WRX STi) on the Isle of Man TT circuit -- have a look around YouTube using yellowcog, Subaru and TT as search terms - you can see just how hard a racing driver needs to work to be the best!
For this video, the car and driver are both well within limits on public roads. Rather than the extremes this video is all about how a driver handles a car in typical conditions. It shows how visually alert a driver needs to be to stay safe. The circle hovering about on the screen is the point the driver is looking at. You can see the eyes flicking between mirrors, road signs and potential hazards. The whole video is like a live monitored version of the Hazard Perception Test (required as part of the UK's driving licence theory test). One thing to watch for is how rather than staring at each-and-every point of interest, the eyes cast across the scene to quickly capture the situation.
Heart rate and breathing are controlled and stable. The driver in this example has a resting heart rate of about 60bpm so being up at 84 represents the extra mental and physical effort that driving requires. We have one example on our files where a drive just like the one here was interrupted when a car pulled unexpectedly out of a side road causing the driver's heart to jump within a beat from 80bpm to 120bpm.